
Fuel is a major running cost for any commercial fleet, yet comparing vehicles fairly is hard. Each vehicle works different routes, in different traffic, with different loads. Road authorities face a similar gap: dangerous junctions have traditionally been identified by counting accidents after they have happened.
Both problems share a question. What can everyday vehicle behaviour, measured at scale, tell us about cost and risk before it shows up in a fuel bill or an accident report?
In 2026, Mobito put that question to two Master’s students through the GeoDS Masters Dissertation Scheme. Working with anonymised connected vehicle data from the Netherlands, they tested what the data can deliver for fleets and for road safety. One of the projects was named in the top three of the national scheme.
A National Scheme Connecting Research and Industry
The GeoDS Masters Dissertation Scheme is run by the Geographic Data Service (GeoDS), funded by Smart Data Research UK. It links Master’s students and their university supervisors with organisations to work on real data problems. The 2026 edition listed 31 projects from 20 partners, and Mobito sponsored two of them.
The scheme is open to students at any UK university. After a competitive selection, Mobito worked with Daniel Hernandez Gramajo, MSc Artificial Intelligence and Digital Health at the University of Westminster, and Hafiz Fisham, MSc Data Science and Analytics at the University of Leeds, a Russell Group university. Each project ran over the spring and summer and became the student’s dissertation.
Where Mobito Comes In
Good research of this kind needs three things: real-world data at scale, a question that matters to industry, and the expertise to use the data well. Mobito contributed all three.
Data at scale. Both students worked with anonymised connected vehicle data from the Netherlands: vehicle movements (probe data) and driving events such as harsh braking and cornering. The data includes aggregated and anonymised commercial fleet data from Webfleet, Bridgestone’s advanced fleet management solution, and covers cars, vans, trucks and buses.
Privacy by design. Vehicle identifiers change every 24 hours, so individual vehicles, drivers and operators cannot be identified or followed over time. Both projects worked within this setup from the start.
Questions and guidance. Mobito’s product and data science team defined both research questions, documented the datasets, and met the students regularly to review methods and results.
“The value of fleet data extends beyond the individual vehicle or fleet. By making aggregated, anonymised vehicle data available to researchers, we can help them tackle practical challenges and explore new ideas. These projects show how everyday journeys can generate insights that benefit fleet operators and the wider transport network.”
Fleet Efficiency: Fairer Fuel Benchmarking for Commercial Fleets
Daniel Hernandez Gramajo, University of Westminster. Operating-Intensity Profiling and Fuel-Efficiency Benchmarking of Commercial Fleets Using Telematics Data.
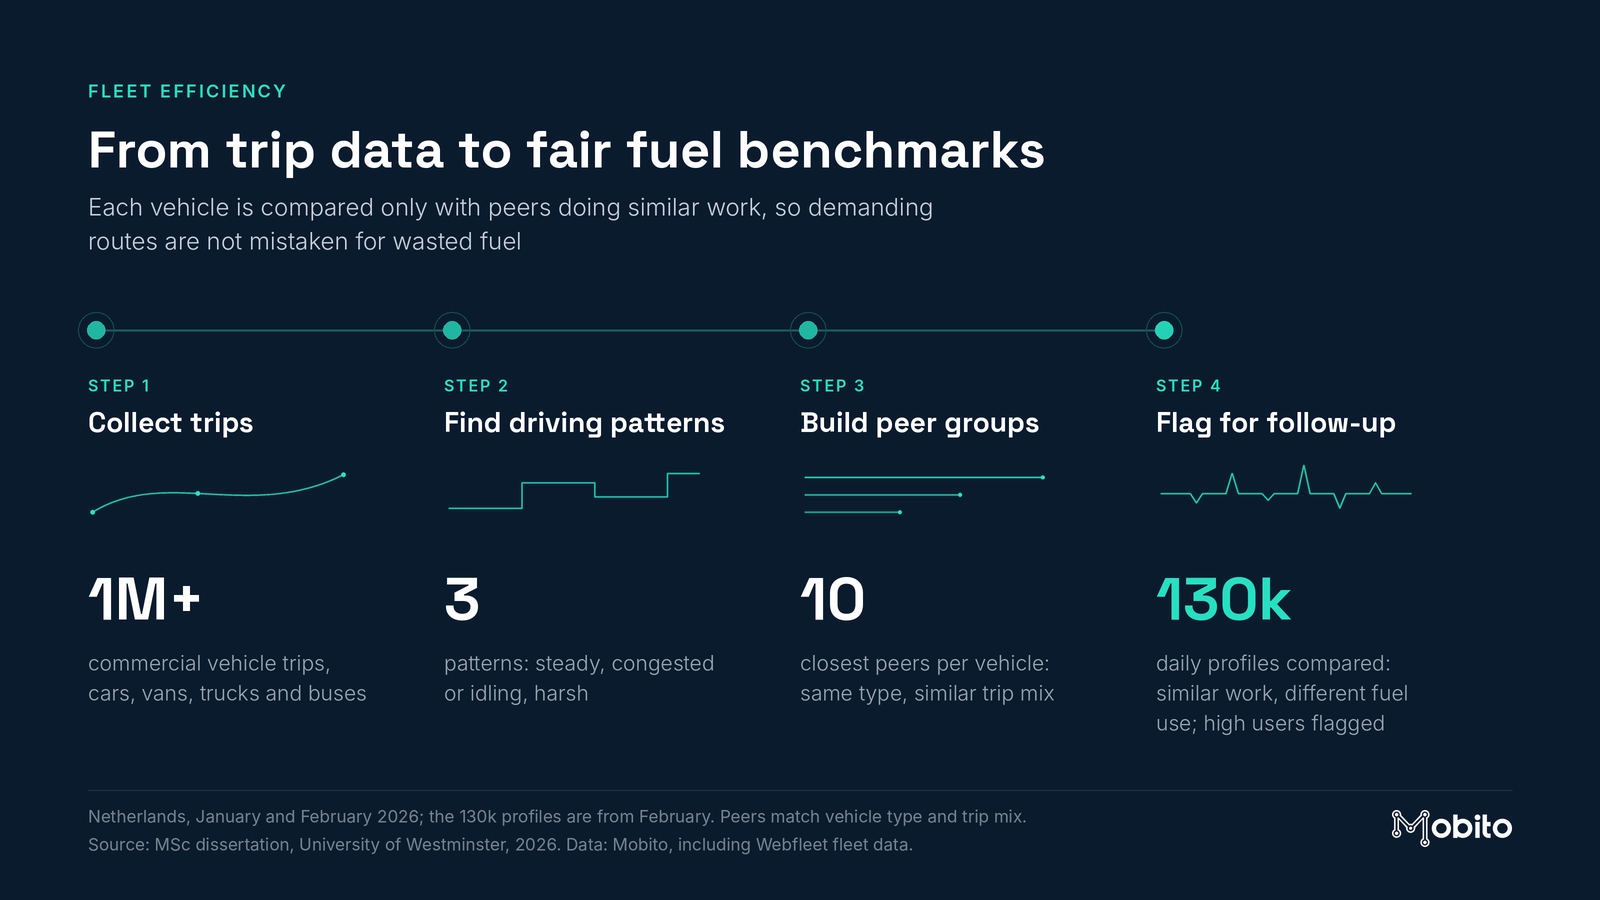
Fleet managers know that some vehicles use more fuel than others, but a simple comparison is often unfair. A truck on an open motorway and a truck in stop-start city traffic will never match, even when both are driven well. To find real inefficiency, each vehicle has to be compared with others working in similar conditions.
Three driving patterns, stable over time
Daniel applied machine learning to more than 1 million commercial vehicle trips and sorted them into three driving patterns: steady driving (47% of trips), congested or idling (23%), and harsh, high-intensity driving (30%). The shares changed by no more than 0.2 percentage points between January and February 2026. Each pattern also matched a distinct road setting, even though road type was not used to create them: steady trips spent 46% of their time on motorways, compared with 8 to 10% for the other two.
Like-for-like comparison shows where to look
Each vehicle’s daily profile was then compared with its 10 closest peers: the same vehicle type, with a similar mix of driving. In February alone, almost 130,000 daily vehicle profiles were benchmarked this way. This shows which vehicles use more fuel than others doing comparable work. Trucks showed the largest gaps against their most efficient peers and cars the smallest, and average speed relative to the speed limit was the strongest predictor of the gap.
For fleet operators, this turns raw telematics into a simple routine: identify vehicles that use more fuel than expected, separate demanding routes from avoidable waste, act, and measure again.
The work earned Daniel an award as one of the top three projects in the 2026 scheme. He presented it at the Data Partners Forum at the University of Oxford in September 2026.
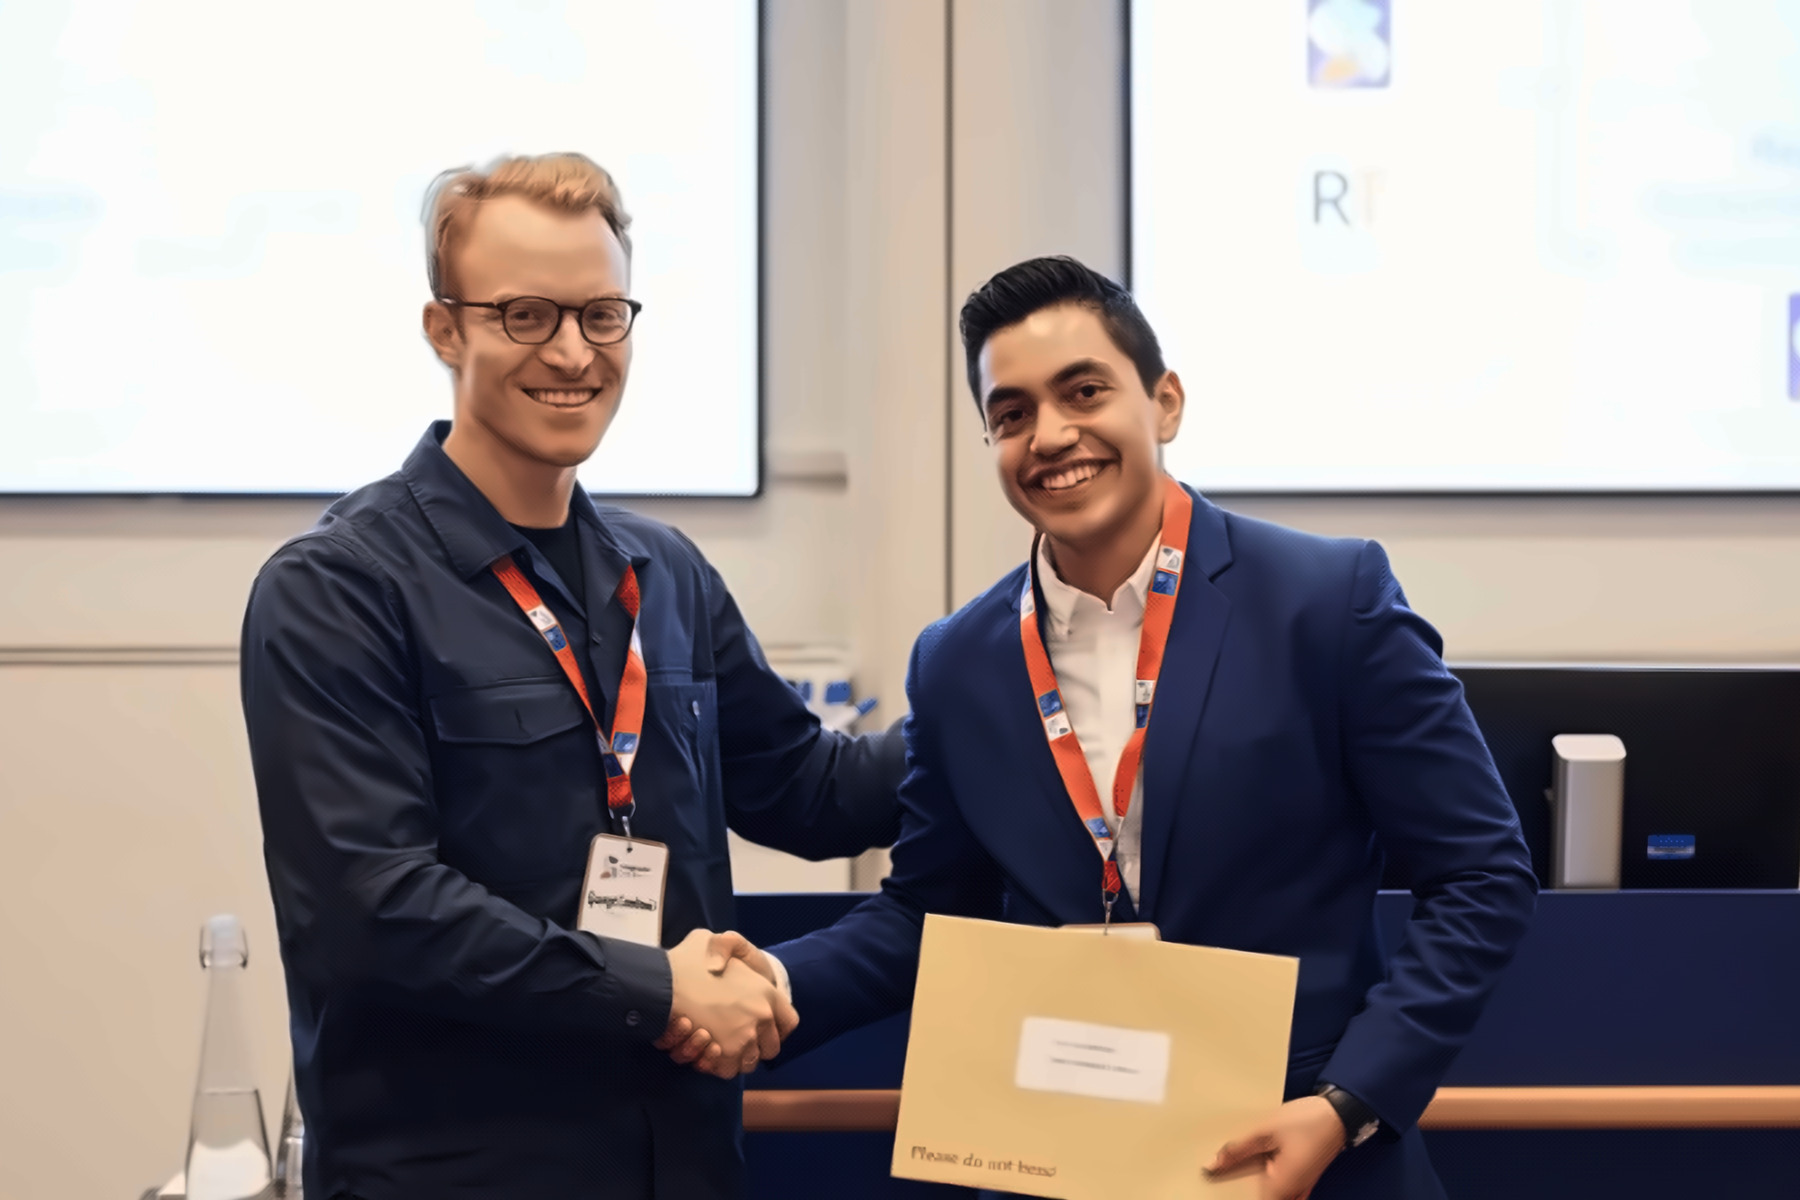
“Working with real fleet data showed me how different applied data science is from working with clean academic datasets. The challenge was not only building the models, but understanding the operational context, dealing with imperfect data and turning the results into insights that fleet managers could actually use.”
Road Safety: Spotting Risky Junctions from Everyday Driving
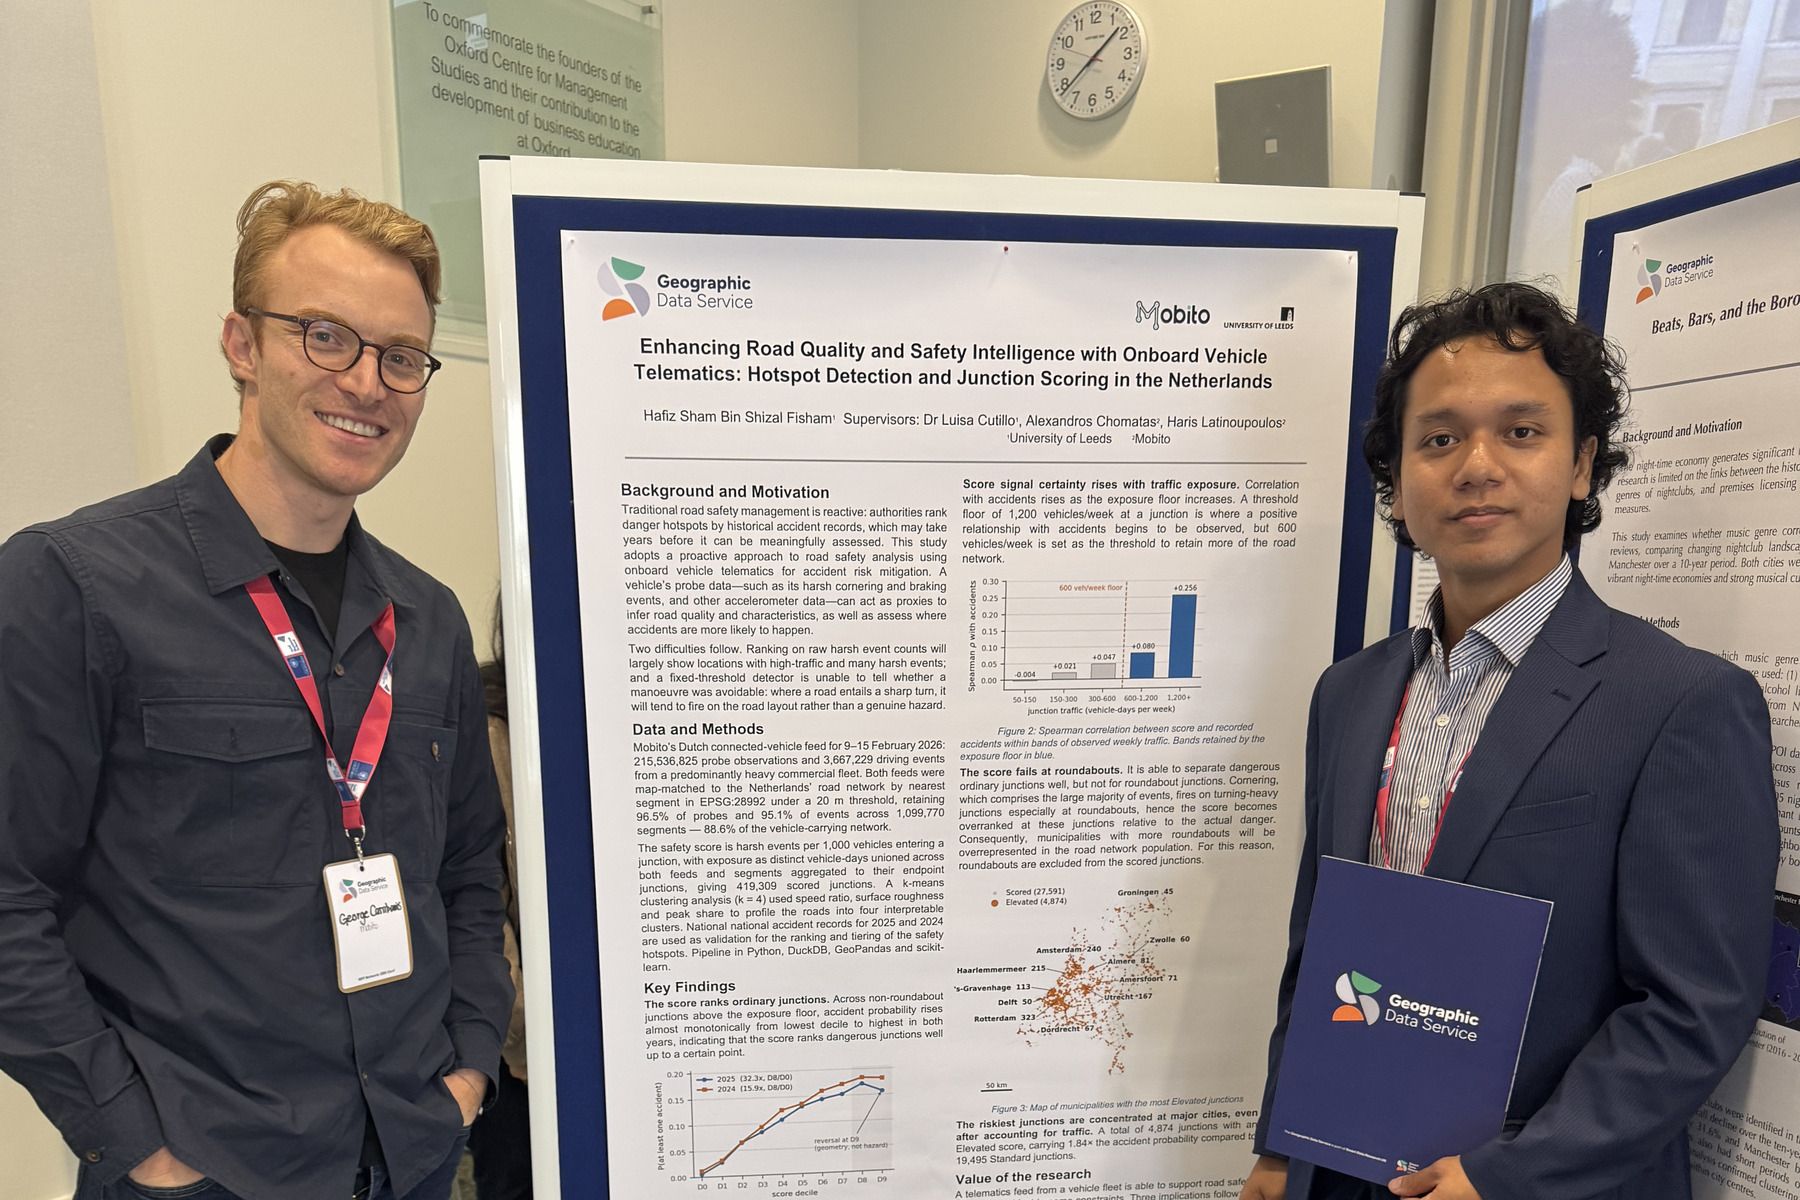
Hafiz Fisham, University of Leeds. Enhancing Road Quality and Safety Intelligence with Onboard Vehicle Telematics: Hotspot Detection and Junction Scoring in the Netherlands.
Road authorities have limited budgets for inspections, so knowing where to look first matters. Counting past accidents means waiting for them to happen. Hafiz asked whether everyday driving data could point to risky junctions sooner.
A risk score built from harsh driving events
Hafiz mapped one week of connected vehicle data from February 2026, with more than 215 million location records and 3.6 million driving events, onto the Dutch national road network. He then ranked 24,369 junctions with enough traffic for a reliable score, by how often vehicles braked or cornered harshly there, per 1,000 vehicles passing through. Adjusting for traffic in this way was key: busy junctions see more events simply because more vehicles use them.
Checked against two years of accident records
The score was tested against official Dutch accident records for 2025 and 2024. In 2025, the highest-scoring tenth of junctions were 29.6 times more likely to have a recorded accident than the lowest-scoring tenth: about 1 in 6, compared with 1 in 190. The pattern held with 2024 records too.
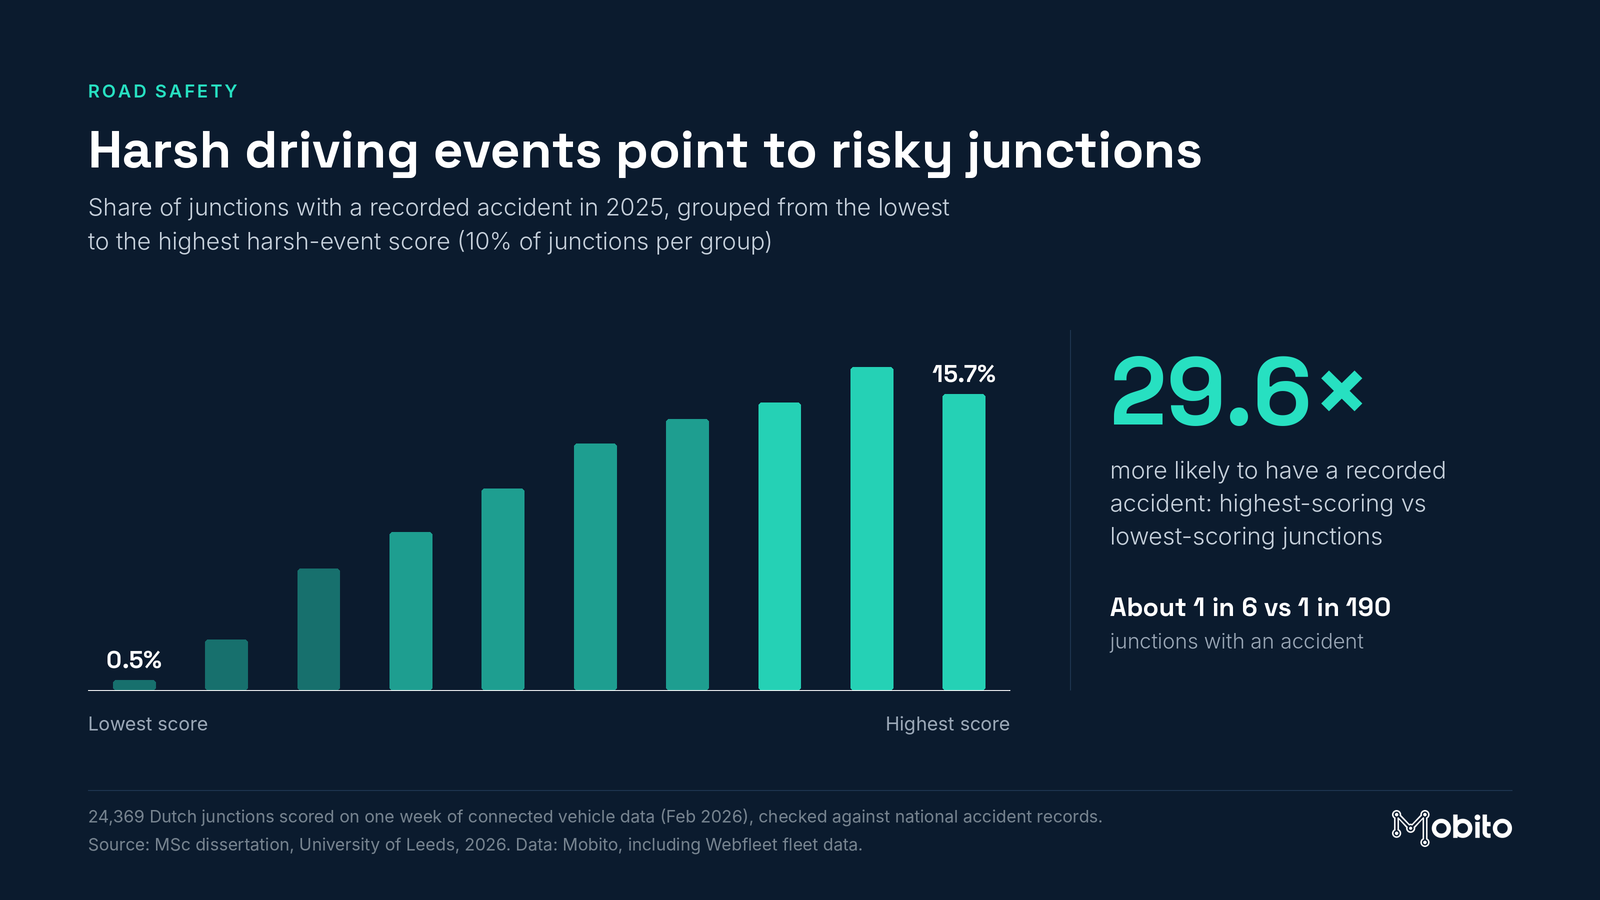
For road authorities, the output is a practical inspection list: 4,874 junctions flagged as “Elevated”, where accidents are almost twice as likely as at the rest. It is built from data that already exists and could be refreshed as new data arrives, with no new roadside equipment. The study is also clear about its limits: roundabouts behave differently and need their own scoring, and the sample is mainly commercial vehicles.
From Research to Practice
Two independent studies, two different problems, one conclusion: anonymised connected vehicle data can answer practical questions that were hard to answer before.
Fleet operators can benchmark fuel use fairly, vehicle by vehicle, and focus action where savings are most likely.
Road authorities can rank junctions for inspection using a score checked against official accident records, without waiting for accidents to accumulate.
Researchers can work with large, real-world datasets that have privacy built in, on questions that matter to industry.
Connected Vehicle Data as a Research Resource
These projects sit alongside other work in which connected vehicle data is used to measure the physical network directly, from the Webfleet Commercial Trip Monitor to planning electric HGV charging in Scotland.
Supporting academic research is part of that work. Independent studies test what the data can and cannot show, and bring new methods to real problems. Both students tested their results with care and were open about the limits of their methods, which is exactly what makes their findings useful. Mobito looks forward to taking part in future editions of the scheme.
We thank Daniel and Hafiz for their work; their supervisors, Dr Andrew Dalby and Timothy Stones at the University of Westminster and Dr Luisa Cutillo at the University of Leeds; the GeoDS team for running the scheme, and Smart Data Research UK, which funds GeoDS; and Webfleet for making this research possible.
Why guess, when mobility data can guide you? Talk to Mobito’s team about applying connected vehicle data to your fleet, road network or research.